48T
$299.00
96T
$399.00


Species:
Human
Alternative Name:
SLC25A7, Thermogenin
Uniport ID:
P25874
Assay Type:
Sandwich
unit:
ng/mL
Standard:
10ng/mL
Sensitivity:
0.1 ng/mL
Detection Range:
0.16-10ng/mL
Assay Time:
3.5H
Sample Type:
Tissue homogenate;Sample Volume=100μL
Research:
CD & Adhesion molecule;
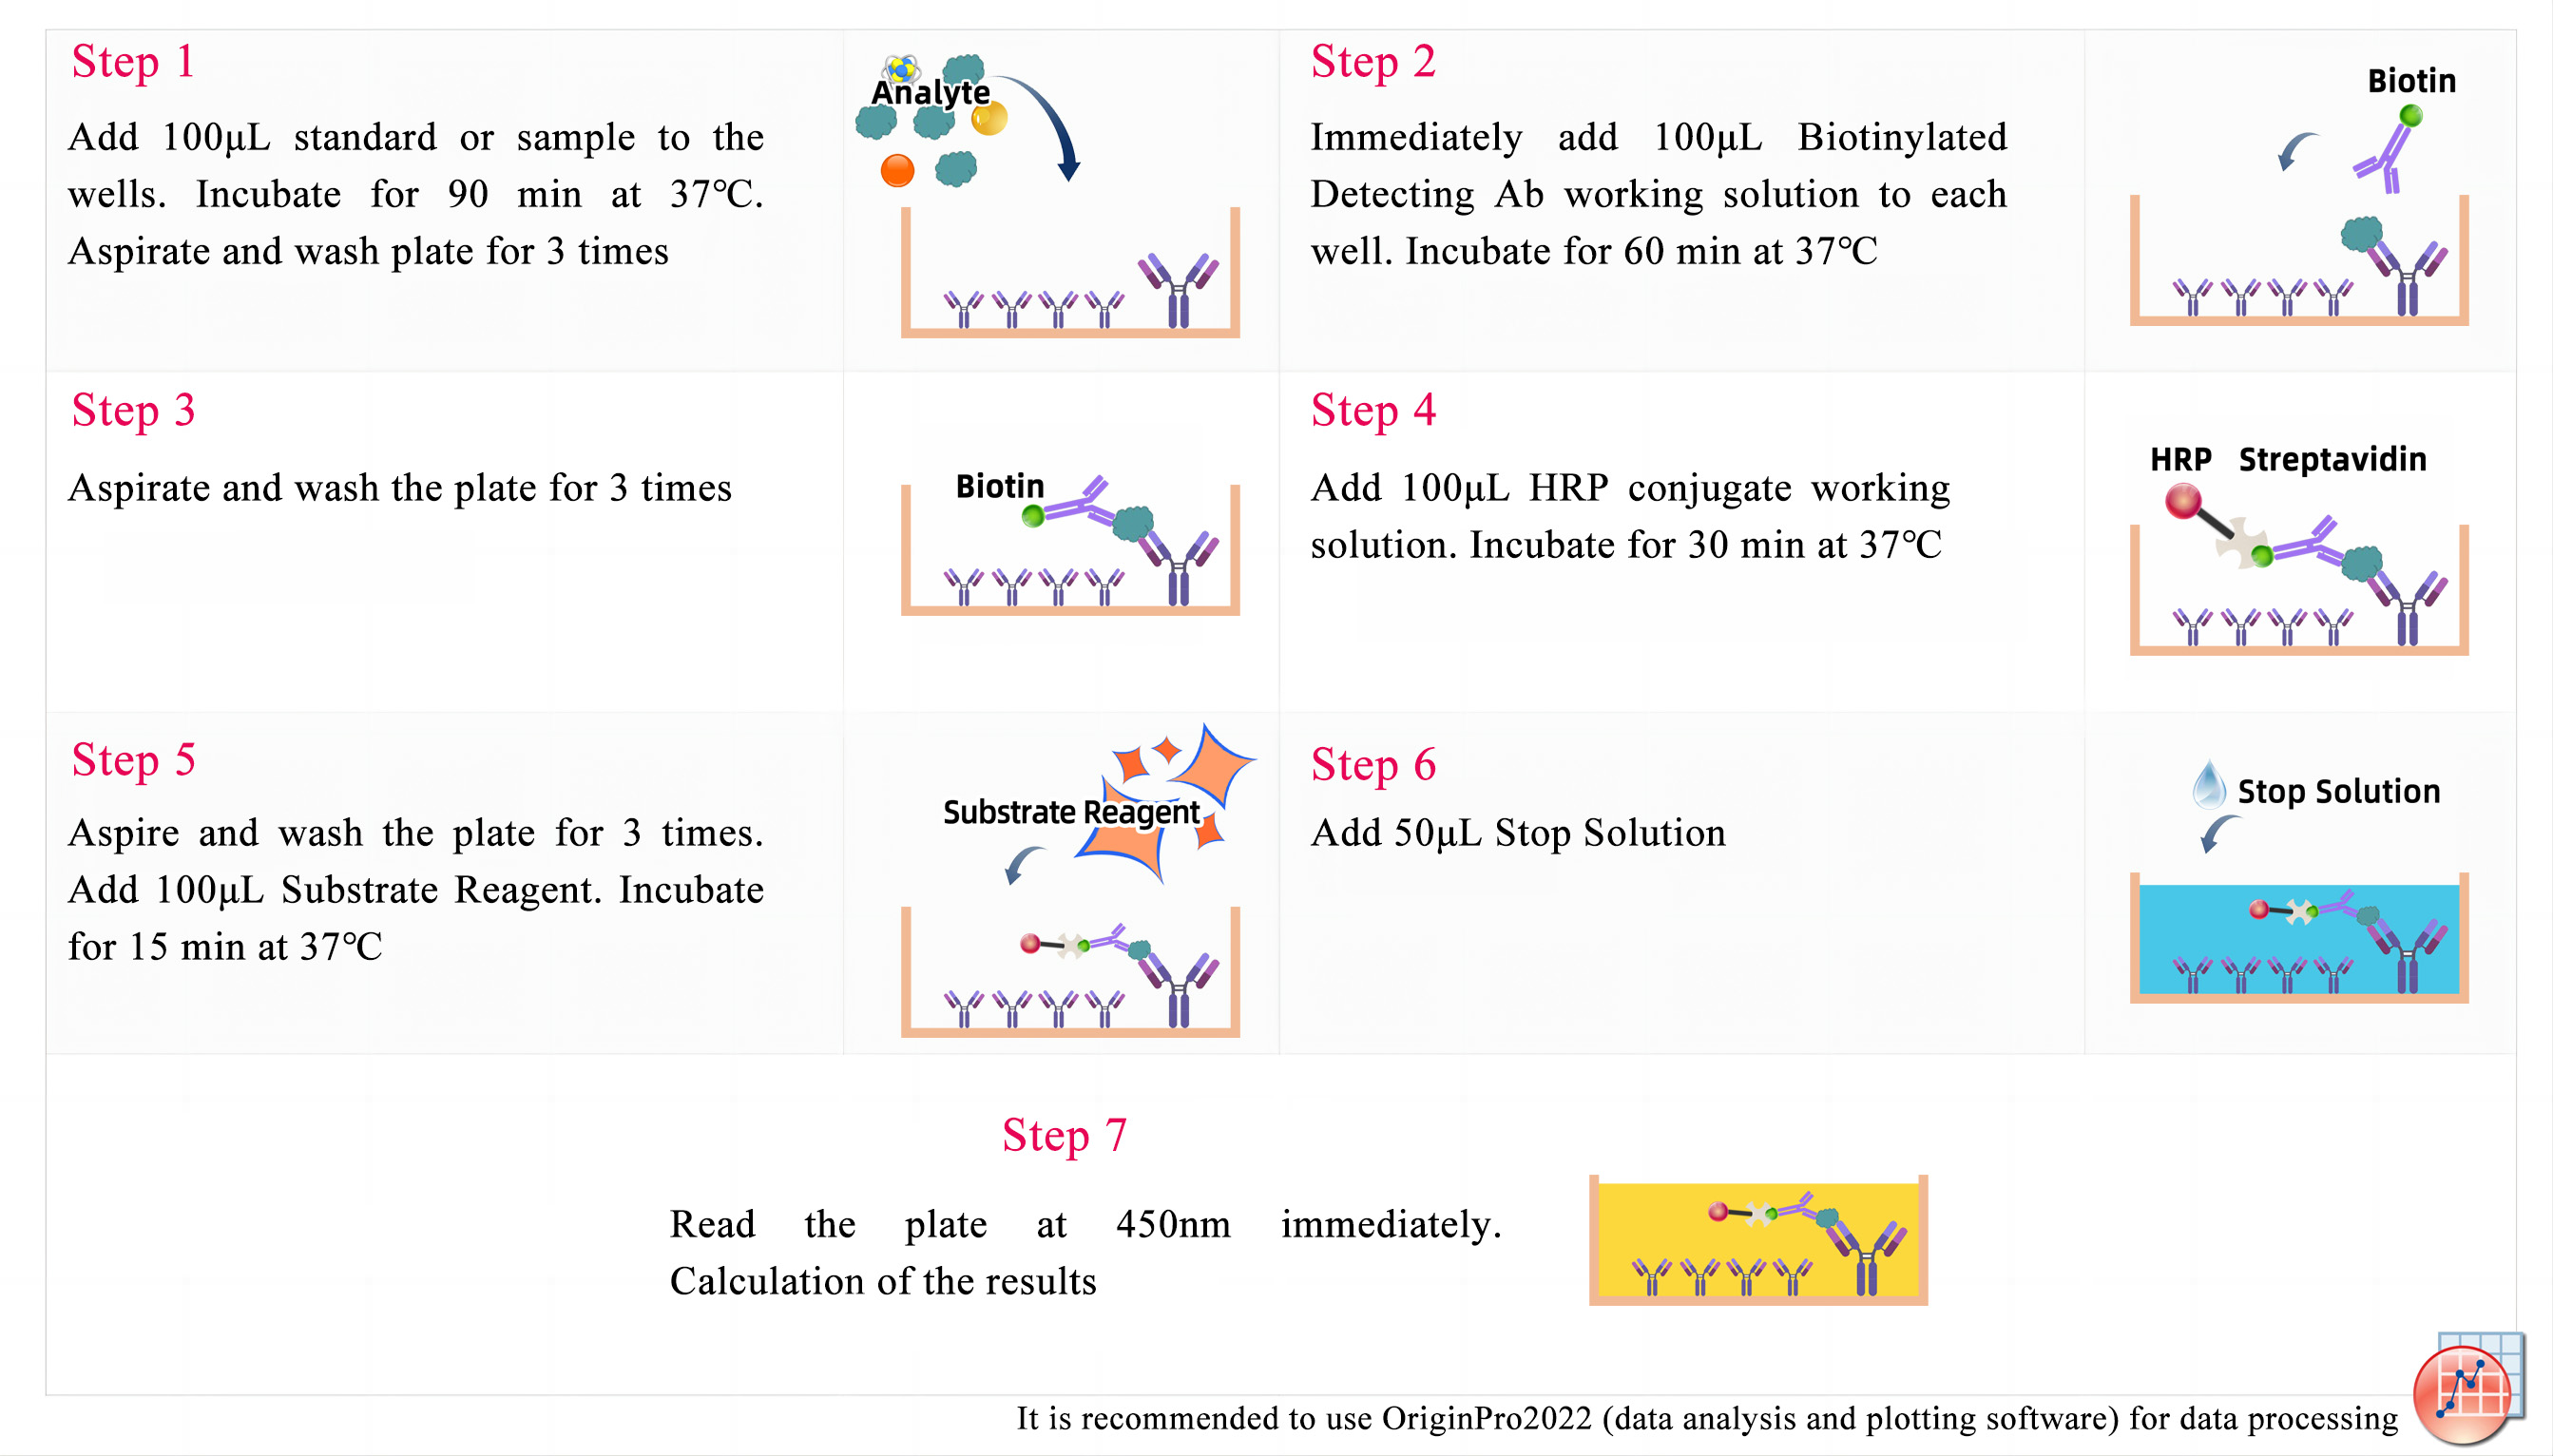
Test Principle:
This ELISA kit uses the Sandwich-ELISA principle. The micro ELISA plate provided in this kit has been pre-coated with an antibody specific to Human UCP-1. Standards or samples are added to the micro ELISA plate wells and combined with the specific antibody. Then a biotinylated detection antibody specific for Human UCP-1 and Avidin-Horseradish Peroxidase (HRP) conjugate are added successively to each micro plate well and incubated. Free components are washed away. The substrate solution is added to each well. Only those wells that contain Human UCP-1, biotinylated detection antibody and Avidin-HRP conjugate will appear blue in color. The enzyme-substrate reaction is terminated by the addition of stop solution and the color turns yellow. The optical density (OD) is measured spectrophotometrically at a wavelength of 450 nm ± 2 nm. The OD value is proportional to the concentration of Human UCP-1.You can calculate the concentration of Human UCP-1 in the samples by comparing the OD of the samples to the standard curve.
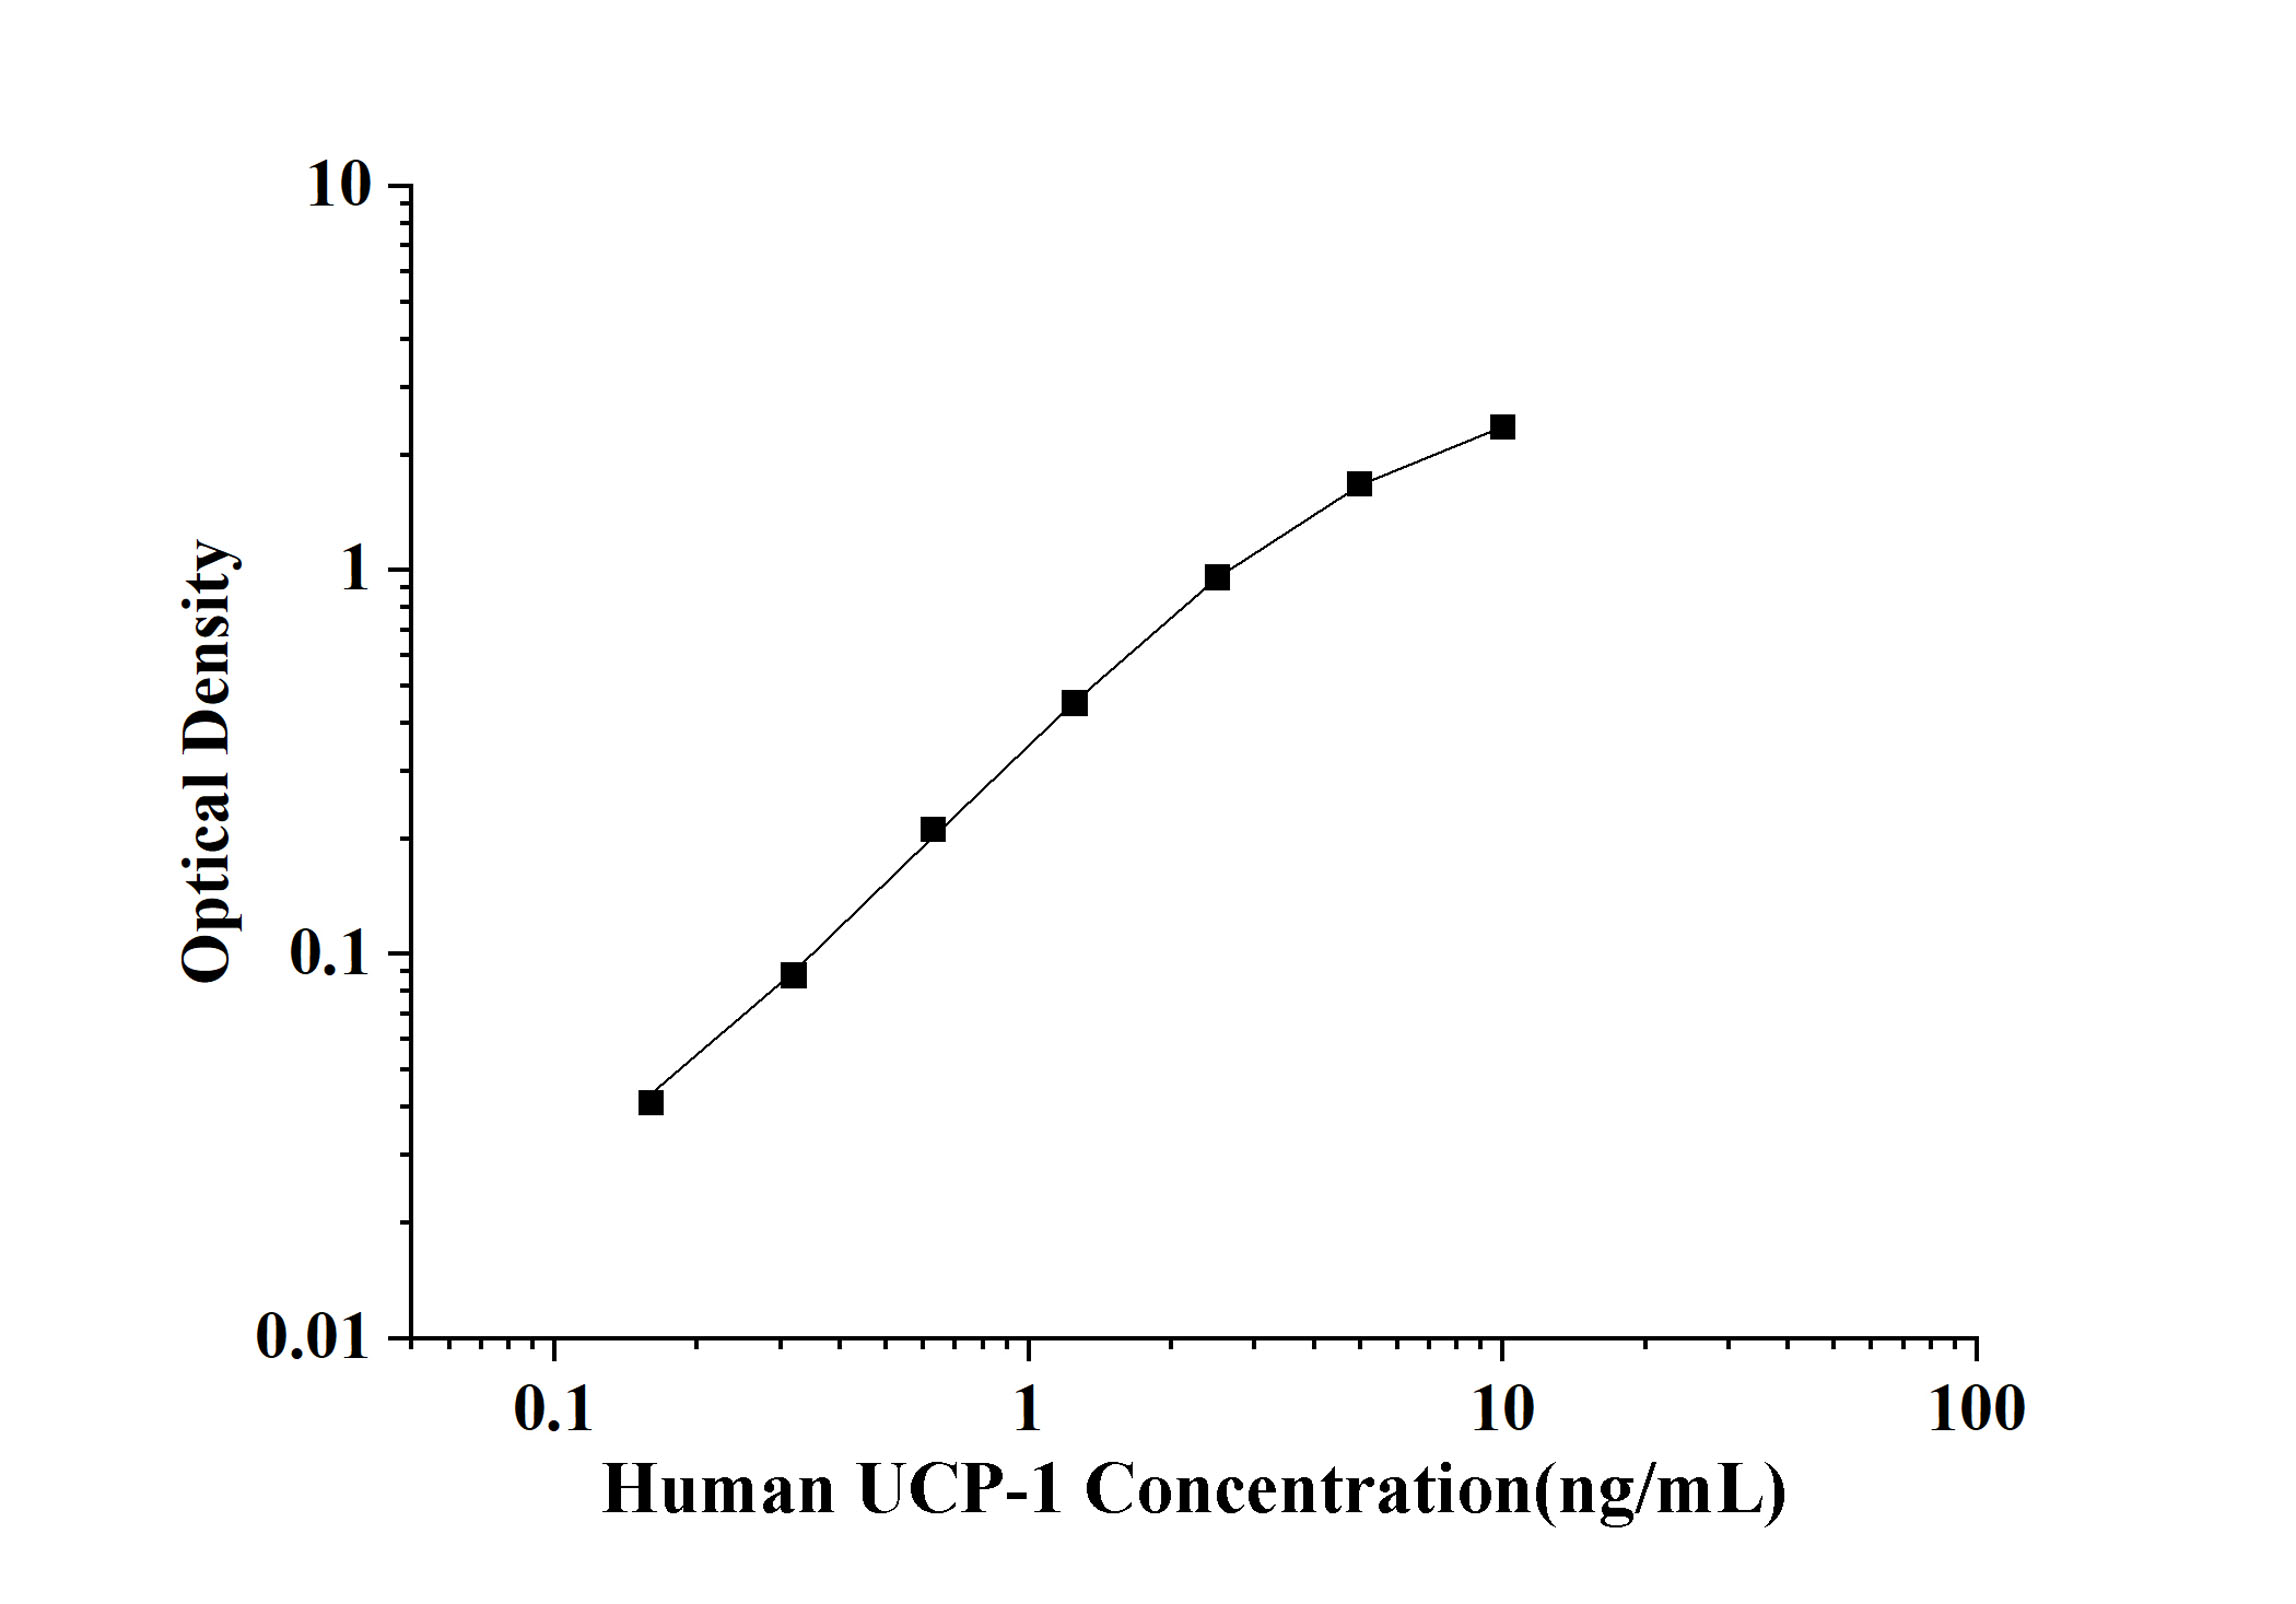
| ng/mL | OD | Corrected |
|---|---|---|
| 10 | 2.396 | 2.358 |
| 5 | 1.711 | 1.673 |
| 2.5 | 0.995 | 0.957 |
| 1.25 | 0.488 | 0.45 |
| 0.63 | 0.249 | 0.211 |
| 0.32 | 0.126 | 0.088 |
| 0.16 | 0.079 | 0.041 |
| 0 | 0.038 | 0 |
Intra-assay Precision (Precision within an assay): 3 samples with low, mid range and high level were tested 20 times on one plate, respectively.
Inter-assay Precision (Precision between assays): 3 samples with low, mid range and high level were tested on 3 different plates, 20 replicates in each plate, respectively.
| Intra-assay Precision | Inter-assay Precision | |||||
|---|---|---|---|---|---|---|
| Sample | 1 | 2 | 3 | 1 | 2 | 3 |
| n | 20 | 20 | 20 | 20 | 20 | 20 |
| Mean(ng/mL) | 0.23 | 2.18 | 3.35 | 0.19 | 1.47 | 4.18 |
| Standard deviation | 0.01 | 0.1 | 0.23 | 0.01 | 0.11 | 0.15 |
| C V (%) | 5.32 | 5.66 | 7.25 | 6.54 | 7.69 | 7.31 |
| Sample Type | Range(%) | Average Recovery(%) |
|---|---|---|
| Serum (n=8) | 90-105 | 97 |
| EDTA plasma (n=8) | 86-99 | 92 |
| Cell culture media (n=8) | 80-95 | 87 |
| Serum (n=5) | EDTA plasma (n=5) | Cell culture media (n=5) | ||
|---|---|---|---|---|
| 1:2 | Range (%) | 85-97 | 85-92 | 92-103 |
| Average (%) | 95 | 91 | 100 | |
| 1:4 | Range (%) | 87-96 | 83-96 | 93-105 |
| Average (%) | 90 | 87 | 102 | |
| 1:8 | Range (%) | 82-95 | 93-102 | 88-101 |
| Average (%) | 86 | 94 | 93 | |
| 1:16 | Range (%) | 92-105 | 87-98 | 97-106 |
| Average (%) | 94 | 93 | 100 |